Every week, organisations waste hours investigating KPI changes that are statistically meaningless
A metric drops, meetings are called, root cause analyses start, and action plans are created. One week later, the KPI is back to normal — on its own, with no intervention needed.
The reality is that, in many cases, there was never a real signal to begin with. This is what happens when organisations do not distinguish noise from signal.
Variation is everywhere
From your doctor measuring blood pressure, to your industrial process electricity consumption, and even monthly financial results – every metric fluctuates.
Recognising variation is not the real challenge. The real question is how organisations should respond to it.
In practice, the misunderstanding usually takes two forms.
- First, organisations work almost exclusively with averages or individual data points, as if variation does not exist.
- Second – and far more expensively – they react to every fluctuation by triggering root cause analyses, crisis teams, and lengthy investigations for changes that are statistically perfectly normal.
The consequences are real: wasted hours, frustrated teams, wrong decisions, and a culture permanently stuck in firefighting mode.
Think about how many hours your organisation spends every week explaining numbers that simply do not need explaining.
A recognisable practical example
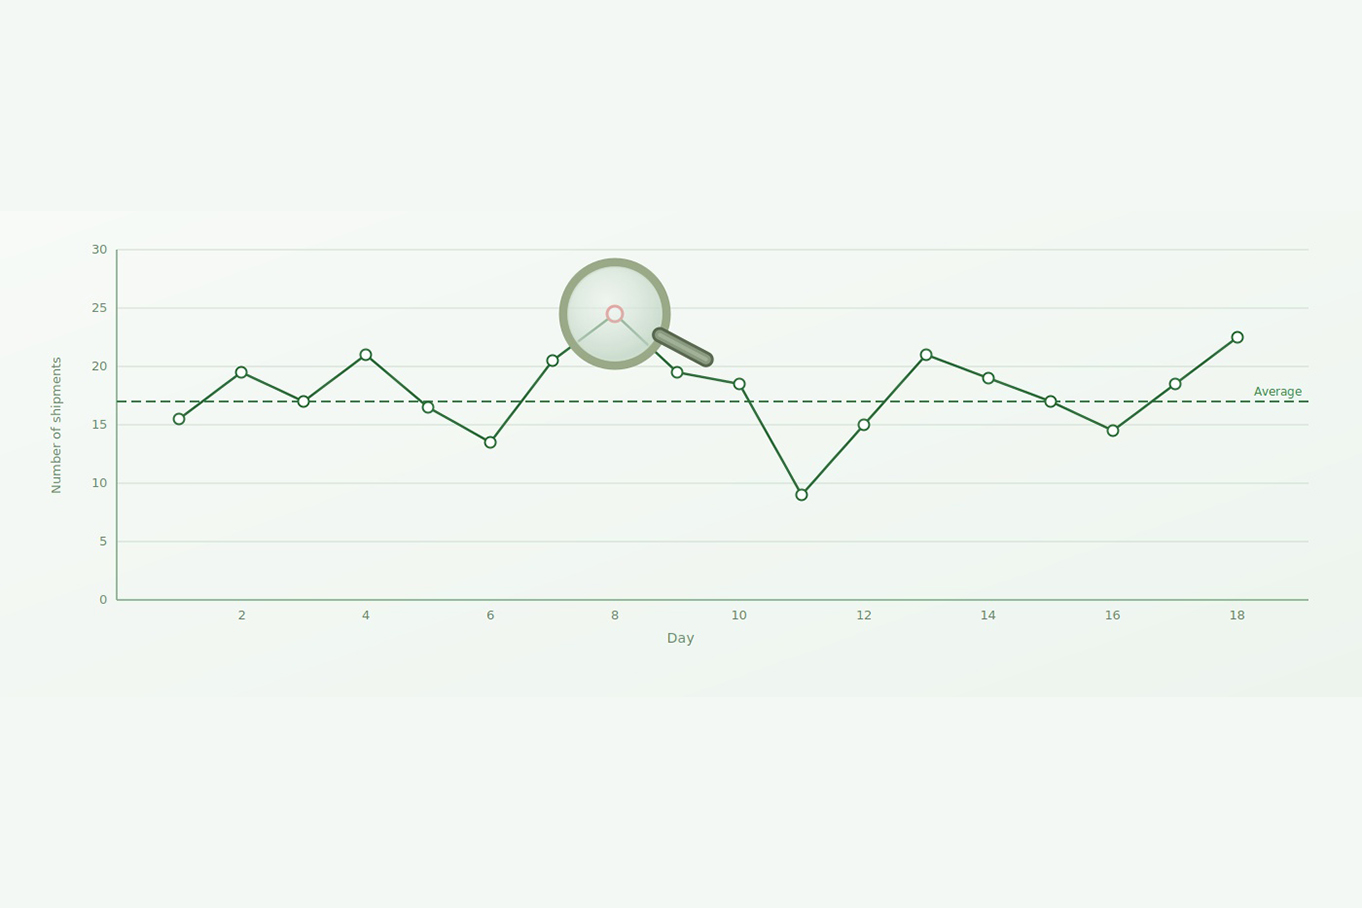
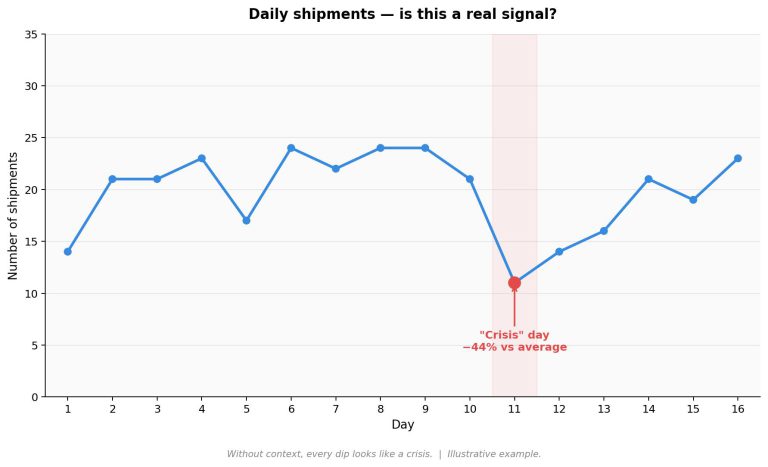
Imagine you are the manager of a logistics company where the number of daily shipments is tracked closely. During the weekly meeting, an employee presents the graph of the past few days.
The target is set at 35 shipments per day, while the average performance is 19.7 shipments.
On day 11, the manager notices three things immediately:
• only 11 shipments – the lowest performance observed so far
• clearly below the target of 35 shipments
• below the historical average as well
The reaction is predictable: “This is concerning. We need to investigate what happened.”
A crisis team is assembled and a root cause investigation begins. Warehouse workers are interviewed, transport is contacted, additional data is requested, and discussions and presentations follow. Before long, five people have spent roughly 30 hours investigating the issue.
Sound familiar?
Over time, reacting to routine variation in this way creates a culture of constant firefighting. Teams become busy explaining fluctuations instead of improving systems. Attention shifts from structural improvement to short-term reactions, often leading to frustration, organisational noise, and wasted energy.
The team eventually implements several corrective actions and, shortly afterwards, the number of shipments improves again. At first sight, this seems to confirm that the investigation was worthwhile.
But there is a problem with that conclusion.
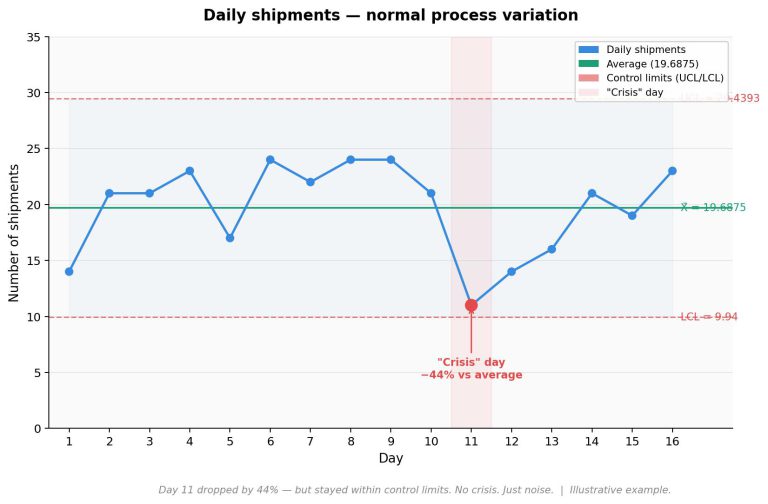
The 11 shipments observed on day 11 were not necessarily a crisis at all. They were simply part of the routine variation of the process – just like the 24 shipments observed on day 8.
Those 30 hours of investigation could have been avoided by understanding the concept of variation and by using a basic process behaviour chart.
A process behaviour chart – as in this case an I-chart – calculates statistically derived limits directly from the data itself, rather than from targets or gut feeling.
As long as the data remains within those statistically derived limits, the variation is considered routine or common cause variation, meaning that no specific intervention is required.
What can you do instead?
The answer is not to ignore poor performance. In this example, the process is genuinely underperforming against the target of 35 shipments per day. That is a real problem worth solving.
However, the solution is not a reactive investigation triggered by a single low data point.
Sustainable improvement comes from a structured, data-driven improvement project focused on understanding and improving the system itself – not from chasing individual fluctuations.
To act, or not to act?
This challenge is not limited to production or quality environments — it applies to any organisation where performance is measured, across sectors and departments alike. Finance is no exception: monthly P&L fluctuations regularly trigger explanations, discussions, and corrective actions, while most of the observed variation is simply routine process behaviour.
Every day, organisations evaluate KPIs and decide whether action is needed. You will probably recognise statements such as:
- “OEE decreased by 4% compared to the average.”
- “Operational costs increased by €10,000 compared to last week.”
- “Process waste increased by 3.5% compared to the same month last year.”
- “Cleaning time during the night shift was extremely high last week.”
- “Our water consumption is steadily increasing.”
- “The contamination index exceeds last month’s average.”
Typical signs that an organisation is reacting to noise include:
• KPI discussions based on a single datapoint
• constant “urgent” investigations
• weekly fluctuations triggering actions
• teams spending time explaining routine variation
• different conclusions every month
• management frustration about unstable metrics
In the majority of cases, these fluctuations are part of common cause variation and therefore require no intervention. Not every fluctuation represents a real change.
The only rigorous way to distinguish signal from noise is to plot data in time order using a process behaviour chart. Everything else is guesswork.
Final Reflection
The question should not immediately be:
“Why did the KPI move?”
The first question should be:
“Was there a real signal at all?”
Because acting on noise does not improve performance. In many cases, it actually undermines it.
Is this masterclass for you?
The framework is straightforward to learn. The cost of not learning it, as this example shows, is anything but.
If you recognise these patterns in your own organisation, the FactWise Masterclass “Understanding Variation” covers the complete framework: how to characterise variation, how to build process behaviour charts, and how to make better decisions using data.
The masterclass is designed for quality professionals, process engineers, managers, and decision-makers who want to stop chasing ghosts and start understanding what their data is really telling them.